Sunday, 2 March 2014

7 Events Risks In The Week starting 2nd March 2014


he week ahead could very well be the most important week of the month. Four central banks from the high income countries meet, the latest purchasing managers surveys will be released and the latest reading on the US labor market will be announced.
At the same time, Russia's move on Crimea and the US and European response may eclipse, at least partially, the economic focus of investors. Lithuania and Latvia have invoked Article 4, which requires consultation over Russia's actions when a member feels its security or independence is threatened. It is only the fourth such action in NATO history.
1. Ukraine (Moderate risk): Neither the US nor Europe are inclined to try to use military force to push Russia out of Crimea. There may be a short-lived wobble to the detriment of risk assets and beneficial for the dollar, yen and Swiss franc. Yet, the impact of geopolitics tends to be transitory. The early July G8 Summit in Sochi may be in jeopardy, but the G7/G8 had already been reduced to a caucus within the G20 and Russia's special role had already been diluted. Dis-inviting Russia from the G8 on grounds of not going to the UN for authority is laughable, given what happened in Iraq, but it does not mean it can't happen.
After Ukraine, Germany may have the most to lose from Russian actions. Its energy program and efforts to de-nuclearize seems to force greater reliance on Russian energy. The Soviet invasion of Afghanistan spurred an increase in military spending (which in the US began under Carter, not Reagan as often suggested). Many countries in the West are reducing military spending presently. There is some risk that China will use the West's distraction to press is case in the South or East China Sea. There may also be knock-on effect in the EU parliamentary election in May, where the anti-EU parties seemed to have moved into ascendancy.
2. China (Low risk): China reported its official manufacturing PMI eased to 50.2 from 50.5 in January. The Bloomberg consensus was for 50.1. Output and orders slipped, while exports remained below the 50 boom/bust level for the third consecutive month. The PMI for large businesses eased to 50.7 from 51.4, while the reading for small businesses is contracting, as the HSBC flash PMI showed. The final manufacturing read and its service PMI, along with the official one, will be released first thing Monday in Beijing. In part, what is happening is a decline in investment, especially in the credit sensitive sectors, like infrastructure and real estate where investment has been excessive.
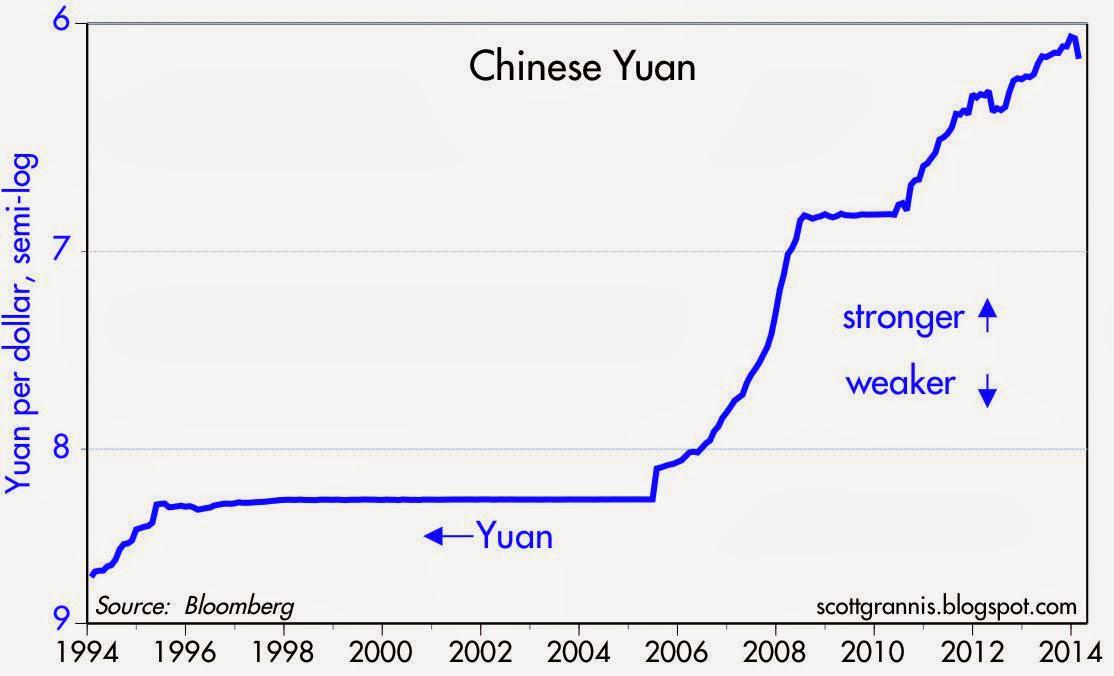
We expect the RMB to stabilize in the week ahead, though last week's decline did not prevent the Shanghai Composite from finishing the week with a three-day rally or the MSCI Emerging Market equity index from ending February at its highest level since January 23. The depreciation of the RMB is too small, given the relatively low-value added being done by Chinese workers, too boost exports and therefore the direct impact on trade is likely minimal at best. The National People's Congress begins at midweek and a solidification of the reform agenda should expected.
3. The Reserve Bank of Australia (Low risk): The RBA meets and the result will be announced Tuesday morning in Sydney. At its last meeting, it indicated that a period of rate stability is best and although the labor market continues to deteriorate and activity outside mining is not picking up sufficiently quickly, it is too soon to expect much of a change in the RBA's stance. The market may decide to ease for it by taking the currency lower. Technically, the February rally looks over and a new push lower appears to have begun. Its failure to resurface above $0.9000 signals initial downside risk back into the $0.8840-80 range.
4. Bank of Canada (Low risk): The Bank of Canada meets Wednesday, March 5. There is little to no chance of a rate cut and the BoC has already shifted its rhetoric to a more dovish/neutral tone since Carney went to the Bank of England. As in the US, the extent of the weather-induced economic disruption is not immediately clear and reasonable people can and do disagree. The February IVEY (Thursday) and jobs data (Friday), the latter to overshadow the January trade figures due out at the same time, may be more important for the Canadian dollar direction.
5. Bank of England (Low risk): Under Carney, the emphasis at the BOE is on using forward guidance to push against market fears of a rate hike sooner than the first part of next year. There is practically no chance of a change in rate. And because the BOE does not say anything when it does not do anything, there is no statement-risk as there is with the other central banks. The three PMIs (construction, manufacturing and service) are expected to show that UK economic activity has leveled off a bit at a reasonably robust pace.
6. European Central Bank (High risk): Of the central bank meetings this week, the ECB's is the only live one in the sense of a realistic possibility of a change. The failure to act in a substantive way could see the euro appreciate. Many, if not most, have focused on what we would regard as a symbolic 10-15 bp cut in the main repo rate. We suspect the euro could rally on this, as it is not the significant rate. It would unlikely even impact forward pricing. With the PMI likely showing continued expansion for the region and the preliminary CPI reading unchanged, officials will not feel compelled to take drastic measures such as adopting a negative deposit rate or launching a sovereign bond purchase program.
There has been some speculation that to boost the excess liquidity to keep EONIA (the key rate) stable and low, the ECB could formally stop sterilizing the SMP purchases. We suspect this would be a very controversial decision. Recall two German ECB members, Weber and Stark, resigned over the program. In the absence of sterilization, this would leave the SMP too close to QE, given the treaty prohibitions. We have advocated cutting the lending rate, which is the top of the official rate corridor and now sits at 75 bp. It is true the cap on EONIA. The ECB is also expected to use the new staff forecasts, that will project out to 2016 for the first time, to point to its belief that the low inflation may persist but the risk of outright deflation for the monetary union is slim. The euro could rally on this because it would strengthen the view that there is no appetite for those drastic measures.
7. US data (High risk): The US jobs data, with the February assessment due on Friday, March 7, tends to be among the most important economic reports of the monthly cycle. Yet, almost regardless of the report, whose thunder is partly stolen by the ADP estimate a couple days earlier, or the week's other data, which includes auto sales, purchasing managers surveys, the Fed's measured tapering pace is unlikely to be disrupted.
The Fed's tapering has not pushed up US 10-year yields this year, which have fallen by 38 bp through the end of February. Nor has it lent the dollar support, which has fallen against all the major currencies and many emerging market currencies (including Indonesian rupiah, Polish zloty, Hungarian forint, South African rand, Mexican peso, Brazilian real and Turkish lira).
Most of the US economic data in recent weeks have been reported below expectations. It means that the market has not fully grasped the magnitude of the slowdown being experienced here in Q1. Few really claim that it is only due to the weather, which has become a bit of a straw man in the blogosphere. We highlight three other forces at work: a) the inventory cycle, b) the end of the tax break for capex and c) the loss of income for 1.7 million Americans who had been collecting emergency jobless benefits. At the end of last week, there were a few secondary economic reports, notably new home sales, durable goods orders and Chicago PMI, were stronger than expected. With more important economic data out this week, it will be important to monitor this pattern, and if, better than expected data lends the dollar support. We suspect it may with a lag.
For the record, the Bloomberg consensus is for a 150k rise in February nonfarm payrolls. This is in line with the 3-month average of 154k, but below the 6-month average (177.5k), which is nearly identical with the 2-year average (179.6k). Although the consensus does not expect a decline in the 6.6% unemployment rate, we see the risk to the downside in response to the loss of the emergency jobless benefits. This is turn would reinforce expectations for a modification/evolution in the FOMC forward guidance at its March 18-19 meeting. Judging from the Fed funds and Eurodollar futures strips, the market is not pricing in the first rate hike until the second half of 2015.
Obama is expected to present the FY15 budget proposals on March 4. This tends not to be a market mover. Moreover, in recent years, due to the political paralysis, the Federal government has operated on the basis of continuing resolutions. Yet the budget proposal will help shape the coming debate. It takes place on the heels of news that FY13 budget deficit wasonly $680 billion from $1.1 trillion the previous year. The budget deficit fell to 4.1% of GDP from 6.8%. It is projected to continue trending lower over the next few years. Obama is expected to avoid further cuts in spending, drop efforts to use chain-weighted CPI measures to slow Social Security payouts and promote public investment.

Abenomics And The Japanese Economy

 Once the second biggest economy in the world and a fountainhead of innovation, the land of the rising sun has gradually slipped down the global rankings after a lost decade, losing out its placing to China. Will Abenomics offer the ray of light that will lead Japan out of the tunnel?
(click to enlarge)
Chart 1. Since 1990 asset bubble bust, the Nikkei 225 has yet to scale new heights (source: Yahoo Charts)
Declining Competitiveness
(click to enlarge)
Chart 2. Japan's balance of trade has been on a downward spiral (sourcewww.tradingeconomics.com)
During the stagnant 90s, Japan's sole bright spot came from its trade surplus as the rest of the world demanded highly innovative Japanese goods. However, since then Japanese competitiveness has been declining in the face of the rising challenge from Korea and China as manufacturing powerhouses. Its once famous and solid trade surplus gave way to a trade deficit for the first time in 2007.
For example, Japan used to be number two in the car manufacturing industry (see 1999 production numbers) but in the most recent survey by OICA, Japan has dropped to number three, producing only slightly more cars than it did in 1999.
Table 1. Japan used to be the second largest producer of automobiles (source: OICA)
Table 2. Japan has dropped to third by 2012 (source OICA)
Economically struggling, politics not helping
While the economic engine face exogenous headwinds, domestic policies have not been given the stability needed for implementation and results. Since Prime Minister Koizumi's term ended in 2006, no Japanese premier has lasted more than one year in office.
Name
Term of office
Dates of birth
Tomiichi Murayama
1994-1996
3 March 1924 (age 89)
Yoshirō Mori
2000-2001
14 July 1937 (age 76)
Junichiro Koizumi
2001-2006
8 January 1942 (age 72)
Yasuo Fukuda
2007-2008
16 July 1936 (age 77)
Taro Aso
2008-2009
20 September 1940 (age 73)
Yukio Hatoyama
2009-2010
11 February 1947 (age 67)
Naoto Kan
2010-2011
10 October 1946 (age 67)
Yoshihiko Noda
2011-2012
20 May 1957 (age 56)
Table 3. Source: Wikipedia, No minister has lasted more than one year in office since the charismatic Junichiro Koizuimi stepped down in 2006
Prime Minister Shinzo Abe was sworn in late 2012 and has become the first premier to last more than one year in office. This has provided the rare political stability for the implementation of public and fiscal policy and his plan nicknamed "Abenomics".
The Three Arrows of Abenomics
Since Prime Minister Shinzo Abe took office in December 2012, he has embarked on a three point plan to revive Japan. His three arrows included a massive fiscal stimulus to increase spending by 2 per cent of GDP, monetary easing to reach a 2 per inflation target and structural reforms to improve Japan's competitiveness.
(click to enlarge)
Chart 3. The First Arrow: government spending has increased but at a slower pace after 2012 (source:www.tradingeconomics.com)
(click to enlarge)
Chart 4. The Second Arrow monetary expansion has driven M3 to a record in 2014 (source: www.tradingeconomics.com)
Has Abenomics Worked?
However, the implications of the first two arrows has been a weakening of the Yen currency (JPY). In the past a weak JPY boosted the trade balance by cheapening exports and making imports dearer. However in modern times, more Japanese production has gone offshore and with increasing reliance on energy imports to make up for the loss of nuclear energy post-Fukushima, the weakened JPY has led to worsening of the balance of trade.
(click to enlarge)
Chart 5. Figure JPY has weakened by 25% vs the USD from 80 to 100 since 2012 (source: Yahoo charts)
(click to enlarge)
Chart 6 Trade deficit has worsened under the Abenomics policy (source:www.tradingeconomics.com)
In other words, the deteriorating trade balance is making GDP growth weaker than where it should have been. More than ever, internal restructuring (the third arrow of Abenomics) is needed to invigorate productivity and sharpen competitiveness. Areas to look at include agricultural reform (see here for a more detailed report on the problems facing Japanese agriculture) and revising the energy policy to re-examine its nuclear policy. Unlike the first two arrows, internal restructuring is more of a long term fix to competitiveness and any short term improvement in the trade balance is unlikely.
Growing from within
With external demand subtracting from GDP growth in the short term, Japan's economy is increasingly reliant on domestic demand in the form of consumption, government expenditure and private investment to drive growth. Consumer spending at JPY 315 trillion makes up 60 % of Japan's JPY 526 trillion economy and has been growing steadily since 2012
(click to enlarge)
Chart 9. Consumer spending has been on a steady rise since 2012 (source:www.tradingeconomics.com)
Despite a growing consumer, GDP growth has been slowing of late as seen in the below forecast figures for the recent quarters, dragged down largely by external demand in the form of the trade deficit.
(click to enlarge)
Chart 8 After the initial Abenomics-induced surge, GDP growth has slowed (source:www.tradingeconomics.com)
With the Japanese consumer facing uncertainty going forward with the increase in sales tax in April to 8% from the current 5%, things do not bode well for the economy in 2014 unless more drastic policy actions are taken.
Conclusion and the challenge ahead
The jury is still out on the success of Abenomics. The first two arrows of increased fiscal spending and monetary expansion have not boosted Japanese competitiveness in the international trade market as much. The third arrow of domestic restructuring still requires time before the impact can be felt. Until then the whale will have to rely on the domestic spending (the consumer, the government and business investment) to drive growth. With the impending rise in sales tax, it remains to be seen if the consumer which forms the bulk of the economy will drive the whale through turbulent seas.
Investment Thesis
From an investment viewpoint, ProShares Ultrashort MSCI Japan ETF looks to be a suitable instrument to gain a short exposure to Japan until the impact of the consumer tax rise is fully reflected in the expected negative GDP growth in the second quarter. Investors with long exposure to the Japan via the ETFs iShares MSCI Jan ETF and ProShares Ultra MSCI Japan ETF may consider trimming the exposure until after further clarity emerges on the government's plans to improve Japanese competitiveness.

Comments (1)
  • When you look at the above chart highlighting Jpan's GDP, it's quite evident that growth in GDP is faltering as the effects of the massive increase fiscal spending wane. Abe was quite eagier to shoot the first two arrows, fiscal spending and additional QE as these are "fun" and politically popular. Even without the third arrow of sturctural reform, they were supposed to expand exports, increase profits and increase wages. But, while corporate profits have increased in part because of a lower currency, exports in real terms have remained stagnant while imports of fossil fuels have increased to replace lost nuclear power, leading to a wider trade imbalance. Further, real consumer incomes have fallen to a sixteen year low becaue profits are not being shared because much of Japan's manufacturing has been moved offshore. Abe, predictably, is dithering on structural reform because of political opposition but if he fails in increasing female labour force participation, consolidating farms, breaking down labour market divisions and raising competition in healthcare – which are sensible and feasible - then Abenomics will go down in history as a failure and Japan will relapse into an economic coma.

The Chinese Economy is not a Problem

Today's breathless China headline: "Chinese Yuan's Drop Is Largest Since Its 2005 Currency Revaluation." Yesterday's headline was even more breathless: "China Currency Plunges Most In Over 5 Years, Biggest Weekly Loss Ever." Reading these headlines, you'd be tempted to think that China was in trouble, but you'd be very wrong.
Here's the "plunge" in the value of the yuan from a big-picture perspective:
(click to enlarge)
That's right, you can barely see the "plunge" when you look at a long-term history of the yuan. Since its all-time high of 6.04 in mid-January, it has dropped a mere 1.7%, to 6.1415. The big story in China continues to be the yuan's impressive strength, not its weakness: it's up 42% vis a vis the dollar in the past 20 years.
(click to enlarge)
And it's not just the yuan appreciating against the dollar. It has appreciated against every currency in the world, and in inflation-adjusted terms as well. As the chart above shows, the real value of the yuan against a large basket of currencies has appreciated by a staggering 85% in the past 20 years. Only the yen has a better record of long-term appreciation: it rose 250% against the dollar from 1970 through 1994 (from 350 yen per dollar to 100).
(click to enlarge)
Spectacular gains in Chinese productivity - which have boosted the size of China's economy by 8-10% per year for the past 20 years - are the main reason the yuan has appreciated. Capital has poured into China, eager to finance and profit from China's impressive progress.
(click to enlarge)
To accommodate the huge increase in the size of China's economy, the Chinese central bank had to expand the Chinese money supply by orders of magnitude. They did this in a very prudent fashion, by buying almost $4 trillion of the capital inflows that China has received over the years. These purchases provided a solid foundation (in the form of an expansion of China's foreign reserves - see chart above) for a necessary expansion of the amount yuan in circulation. (Think of the growth of China's foreign exchange reserves as a proxy for net capital inflows.) Yet even though it bought trillions of dollars with newly-created yuan, the central bank allowed the yuan to appreciate. In a sense, they didn't buy enough dollars and euros, and that created an effective shortage of yuan which could only be resolved via a yuan appreciation.
But as the chart above also shows, China's accumulation of reserves has slowed down significantly over the past few years. That's because the central bank has liberalized capital flows, and the strong appreciation of the yuan has brought China's costs more into line with costs overseas, with the result that the economy has cooled off. With capital inflows "tapering" off, there is much less pressure for the yuan to appreciate. The central bank is correct in allowing (and even encouraging) the yuan to trade more freely. The yuan was on a one-way street (appreciating) for the past 8-9 years, and that can't go on forever. Looking ahead, it's likely that the yuan will bounce around in a relatively stable channel, rather than constantly appreciating. This new perception alone could help reduce capital inflows and avoid any unnecessary or unwarranted "overheating" of the economy.
(click to enlarge)
For the past 15 years or so, Chinese inflation has been very similar to U.S. inflation, as the chart above shows. But since the yuan appreciated against the dollar by about 37% over this same period, Chinese prices effectively rose by roughly that amount relative to U.S. prices. This has made China somewhat less competitive, and that has worked to slow its growth on the margin. But it's still growing by at least 7% a year. And the central bank still has almost $4 trillion of reserves, which makes the yuan potentially the most rock-solid currency on the planet. What's not to like about a growing economy and a strong currency and low inflation?